オルタナティブ分析(自己相関確認)

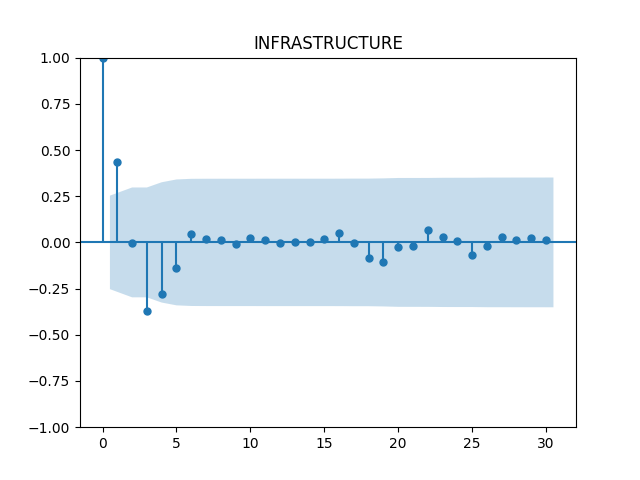
[ 1. 0.43597786 -0.00141242 -0.37030068 -0.28066717 -0.13699
0.04449043 0.0192803 0.01226102 -0.00681176 0.02581203 0.01252838
-0.00370758 0.00257623 0.00280707 0.01996028 0.05029802 -0.00308233
-0.08175853 -0.10682088 -0.02294111 -0.02104138 0.06825262 0.0299488
0.00988396 -0.06968772 -0.01778294 0.02956392 0.01267661 0.02469149
0.01261946]

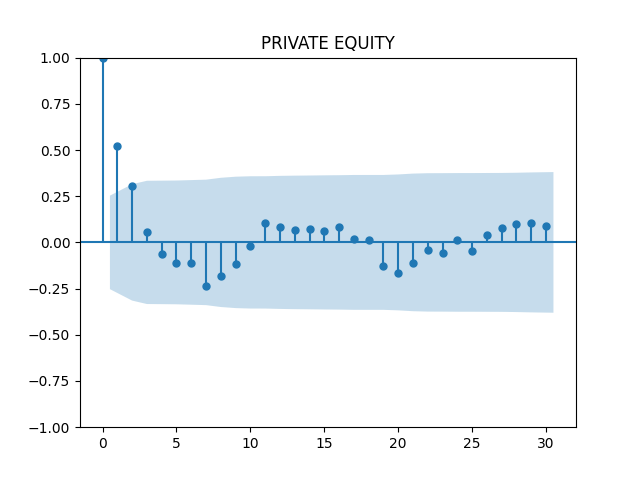
[ 1.          0.52362501  0.30720655  0.05857342 -0.06302102 -0.10938737
 -0.10947093 -0.23366213 -0.18038957 -0.11620086 -0.02027784  0.10721011
  0.08150679  0.06604361  0.07351487  0.06292506  0.08340198  0.01649945
  0.01452813 -0.12522224 -0.16334785 -0.11089265 -0.03970408 -0.05509672
  0.01212133 -0.04606937  0.0392246   0.07978909  0.10053269  0.1071743
  0.08894171]
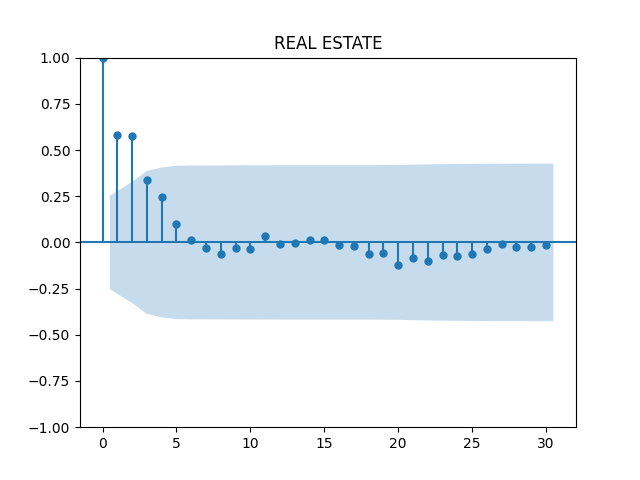
[ 1.          0.58312994  0.57341579  0.3386618   0.2452663   0.09993164
  0.01208326 -0.02804588 -0.06515453 -0.0285715  -0.03706237  0.03564115
 -0.00676597 -0.00448583  0.01267787  0.01175792 -0.0123242  -0.02160373
 -0.06352386 -0.05638086 -0.11984074 -0.08228193 -0.10007085 -0.06561303
 -0.07531393 -0.06032336 -0.0347079  -0.00800762 -0.02426283 -0.02696064
 -0.01137858]

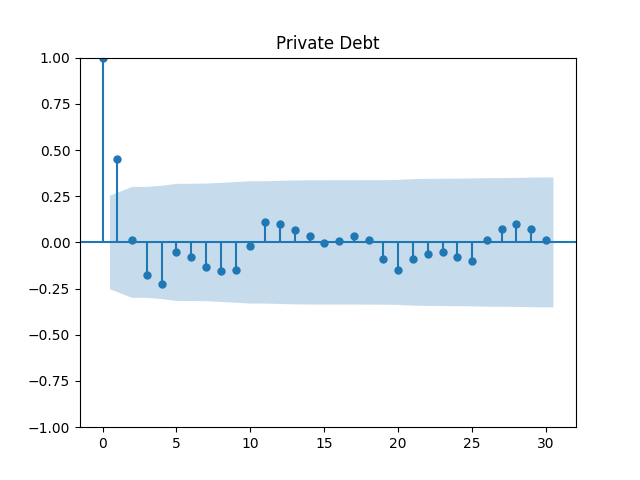
[ 1.          0.45112326  0.0130016  -0.17399847 -0.22364552 -0.05034572
 -0.07734269 -0.13272034 -0.15243473 -0.14863573 -0.01734632  0.10805292
  0.10178218  0.06887129  0.03404459 -0.00405576  0.01010758  0.03712769
  0.01179166 -0.09192385 -0.14772906 -0.08859146 -0.0619941  -0.05045365
 -0.07722673 -0.10044462  0.01273138  0.07189885  0.09982746  0.0735928
  0.01202728]
<使用データ>
<参考資料>
import numpy as np
import pandas as pd

# 統計モデル
import statsmodels.api as sm

from matplotlib import pylab as plt

filepath = 'C:\\Users\\XXXXXXXXXXXXXXXXXXXXXXXXXXXXXXXXXXXXXXXXX'
df = pd.read_csv(filepath + 'preqin_return202212.csv',dtype=str,usecols=['DATE','INFRASTRUCTURE','REAL ESTATE DEBT','PRIVATE EQUITY','REAL ESTATE','Private Debt'],index_col='DATE',parse_dates=True)

alt_style = 'Private Debt'

#df['前日比%'] = df['前日比%'].astype('str')
df[alt_style] = df[alt_style].str.replace('%', '')
df[alt_style] = df[alt_style].astype(float)
df[alt_style] = df[alt_style]/100

# データセット確認
# print(df[alt_style])
# plt.plot(df[alt_style])
# plt.show()

# 自己相関を求める
df_acf = sm.tsa.stattools.acf(df[alt_style], nlags=30)
print(df_acf)
#  自己相関のグラフ
# fig = plt.figure(figsize=(12,8))

fig = sm.graphics.tsa.plot_acf(df[alt_style], lags=30)
plt.title(alt_style)
plt.show()

