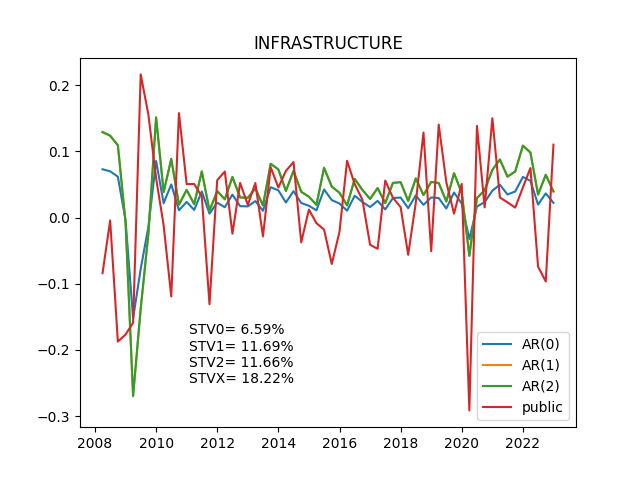
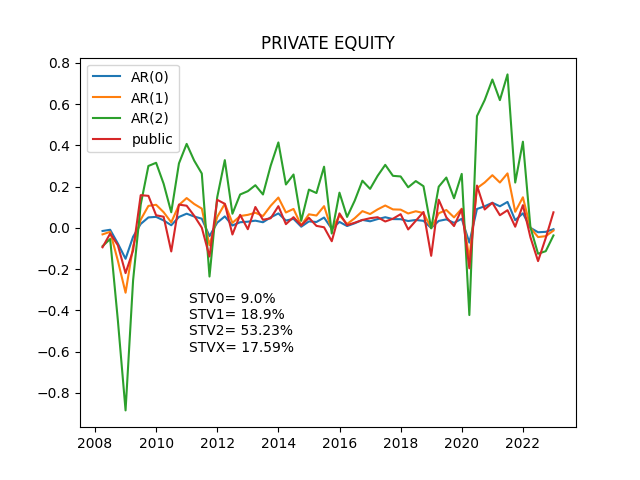
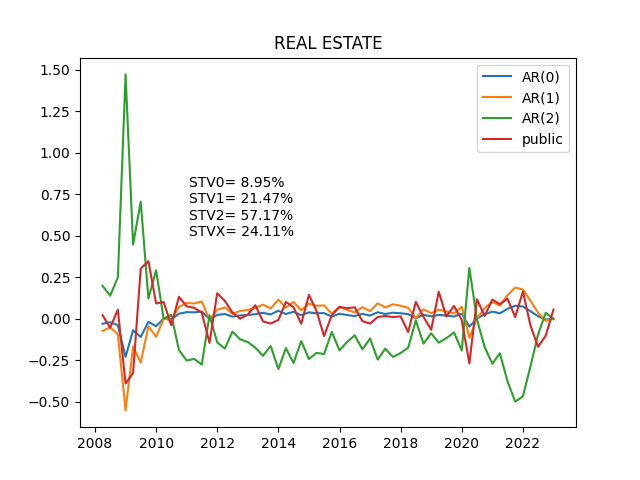
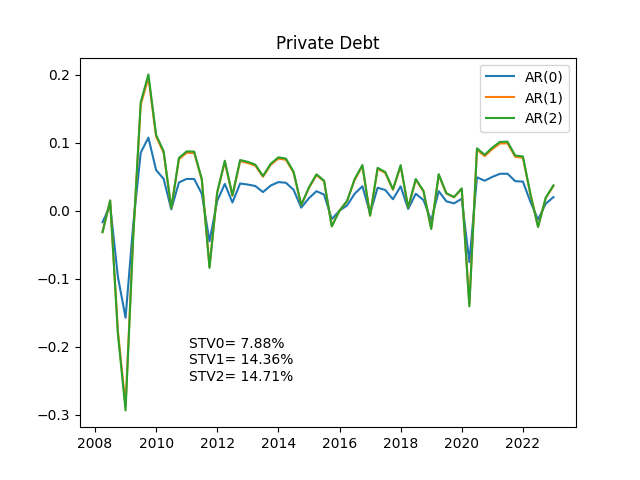
オルタナティブ分析(リターン複製)


<使用データ>
<コード>
import numpy as np
import pandas as pd

# 統計モデル
import statsmodels.api as sm

# from matplotlib import pylab as plt
from matplotlib import pyplot as plt

filepath = 'C:***********************************************************'
df = pd.read_csv(filepath + 'preqin_return202212_2.csv',dtype=str,usecols=['DATE','INFRASTRUCTURE','REAL ESTATE DEBT','PRIVATE EQUITY','REAL ESTATE','Private Debt','PUBRIC_US_STOCK','PUBRIC_US_REIT','PUBRIC_US_INFRA'],index_col='DATE',parse_dates=True)

alt_style = 'PRIVATE EQUITY'

#df['前日比%'] = df['前日比%'].astype('str')
df[alt_style] = df[alt_style].str.replace('%', '')
df[alt_style] = df[alt_style].astype(float)
df[alt_style] = df[alt_style]/100

pblic_style = 'PUBRIC_US_STOCK'
# 'PUBRIC_US_STOCK','PUBRIC_US_REIT','PUBRIC_US_INFRA'
df[pblic_style] = df[pblic_style].str.replace('%', '')
df[pblic_style] = df[pblic_style].astype(float)
df[pblic_style] = df[pblic_style]/100

# データセット確認
# print(df[alt_style])
# plt.plot(df[alt_style])
# plt.show()

# 自己相関を求める
df_acf = sm.tsa.stattools.acf(df[alt_style], nlags=30)
# 1期前
kei1=1-df_acf[1]
# 2期前
kei2=1-df_acf[1]-df_acf[2]

print(kei1)
print(kei2)

# データフレーム作成
newdf = pd.DataFrame(df[alt_style])
newdf['AR_1'] = df[alt_style]/kei1
newdf['AR_2'] = df[alt_style]/kei2
# 比較用上場インデックス組入れ
newdf['public'] = df[pblic_style]

sem0_df = np.std(df[alt_style])*2*100
sem1_df = np.std(newdf['AR_1'])*2*100
sem2_df = np.std(newdf['AR_2'])*2*100
semX_df = np.std(newdf['public'])*2*100

sem0_df = round(sem0_df,2)
sem1_df = round(sem1_df,2)
sem2_df = round(sem2_df,2)
semX_df = round(semX_df,2)

pltstr = 'STV0= ' + str(sem0_df) + '%'
pltstr = pltstr + '\n' + 'STV1= ' +  str(sem1_df) + '%'
pltstr = pltstr + '\n' + 'STV2= ' +  str(sem2_df) + '%'
pltstr = pltstr + '\n' + 'STVX= ' +  str(semX_df) + '%'
# print(pltstr)

#  リターングラフ
plt.title(alt_style)
plt.plot(newdf)
plt.legend(['AR(0)','AR(1)','AR(2)','public'])
x = 15000
y = -0.6
plt.text(x,y,pltstr,fontsize=10,color='black')
plt.show()

