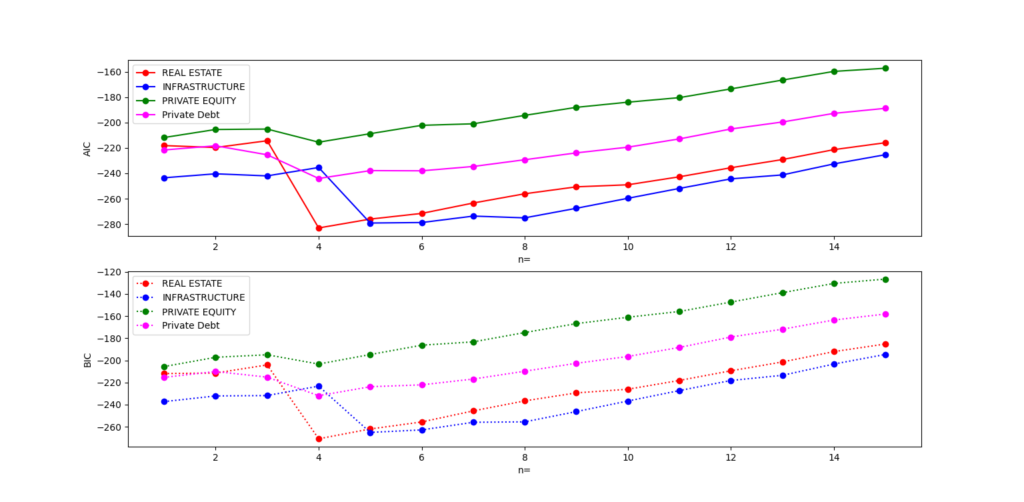
import numpy as np
import pandas as pd

# 統計モデル
import statsmodels.api as sm

# from matplotlib import pylab as plt
from matplotlib import pyplot as plt
from statsmodels.tsa.ar_model import AutoReg

filepath = '・・・・・Asset_alocation\\Unsmoothed\\'
df = pd.read_csv(filepath + 'preqin_return202212_2.csv',dtype=str,usecols=['DATE','INFRASTRUCTURE','REAL ESTATE DEBT','PRIVATE EQUITY','REAL ESTATE','Private Debt','PUBRIC_US_STOCK','PUBRIC_US_REIT','PUBRIC_US_INFRA'],index_col='DATE',parse_dates=True)

asset_style = ['INFRASTRUCTURE','REAL ESTATE DEBT','PRIVATE EQUITY','REAL ESTATE','Private Debt']

for style in asset_style:
    alt_style = style
    # 'INFRASTRUCTURE','REAL ESTATE DEBT','PRIVATE EQUITY','REAL ESTATE','Private Debt'

    df[alt_style] = df[alt_style].str.replace('%', '')
    df[alt_style] = df[alt_style].astype(float)
    df[alt_style] = df[alt_style]/100
    y_private = df[alt_style]

    list_AIC = pd.DataFrame(columns = [style])
    list_BIC = pd.DataFrame(columns = [style])

    # # 確認用
    # mod = AutoReg(y_private,5)
    # res = mod.fit()
    # print(res.summary())
    # # 確認終了

    for i in range(1, 16):
        # ARモデルの構築

        mod = AutoReg(y_private,i)
        res = mod.fit()

        df_AIC = pd.DataFrame({style: [res.aic]},index=[i])
        df_BIC = pd.DataFrame({style: [res.bic]},index=[i])
        list_AIC = pd.concat([list_AIC, df_AIC])
        list_BIC = pd.concat([list_BIC, df_BIC])

    # print(style)
    # print(list_AIC)
    # print(list_BIC)

    if style == 'INFRASTRUCTURE':
        ALLlist_AIC =  list_AIC
        ALLlist_BIC =  list_BIC
    else:
        ALLlist_AIC = pd.concat([ALLlist_AIC, list_AIC])
        ALLlist_BIC = pd.concat([ALLlist_BIC, list_BIC])

# AIC
plt.subplot(211)
plt.plot(ALLlist_AIC['REAL ESTATE'], color = 'red', marker = 'o',label='REAL ESTATE')
plt.plot(ALLlist_AIC['INFRASTRUCTURE'], color = 'blue', marker = 'o',label='INFRASTRUCTURE')
plt.plot(ALLlist_AIC['PRIVATE EQUITY'], color = 'green', marker = 'o',label='PRIVATE EQUITY')
plt.plot(ALLlist_AIC['Private Debt'], color = 'magenta', marker = 'o',label='Private Debt')
plt.xlabel('n=')
plt.ylabel('AIC')
plt.legend()

# BIC
plt.subplot(212)
plt.plot(ALLlist_BIC['REAL ESTATE'], linestyle = "dotted",color = 'red', marker = 'o',label='REAL ESTATE')
plt.plot(ALLlist_BIC['INFRASTRUCTURE'], linestyle = "dotted", color = 'blue', marker = 'o',label='INFRASTRUCTURE')
plt.plot(ALLlist_BIC['PRIVATE EQUITY'], linestyle = "dotted",color = 'green', marker = 'o',label='PRIVATE EQUITY')
plt.plot(ALLlist_BIC['Private Debt'], linestyle = "dotted",color = 'magenta', marker = 'o',label='Private Debt')
plt.xlabel('n=')
plt.ylabel('BIC')
plt.legend()

plt.show()


